Raspberry Pi -
Temperature Data Logger / Grapher
revised 01-25-2013 d. bodnar
| I have been working with the
Raspberry Pi for a few months and have had a great time
experimenting. See my other page of notes on the Pi
here. My current project is to use the Pi as a data logger that will read temperature data from one or more DS18B20 temperature sensors. This data will be recorded to a file and periodically graphed and posted on the Internet. I have also begun expanding this work to reading humidity. My notes are here. GNUPlot, a command line graphing program, will be used to produce the graphs.
Sample graphs (may be up-to-date or not depending on
what I am doing to them) can be seen by clinking on this link.
I have also been working on a Temperature / Humidity
grapher - notes re here:
|
| Initial Installation Install 2012-09-18-wheezy-raspbian and use the integrated options to set keyboard, locale, time zone, keyboard, over clock, SSH and updates. It can be downloaded here: http://www.raspberrypi.org/downloads I had to redo the keyboard layout - see: http://www.raspberrypi.org/phpBB3/viewtopic.php?f=26&t=9136 (reboot after) Restart and test SSH (using Putty) - SSH will allow you to access the Pi from a desktop or laptop computer - very convenient! Set up for static IP address (I used 192.168.1.35) - see: http://www.stuffaboutcode.com/2012/05/raspberry-pi-setting-static-ip-address.html Install Python (if needed) - note: ver 2.7.3rc2 May 2012 was already on my installation Set up Samba - see:
http://cymplecy.wordpress.com/2012/08/08/treating-a-raspberrypi-as-just-another-windows-machine-4-2/
don't forget to set password: I also like to change the name of the Pi so that it is easier to identify. See: http://www.simonthepiman.com/how_to_rename_my_raspberry_pi.php |
|
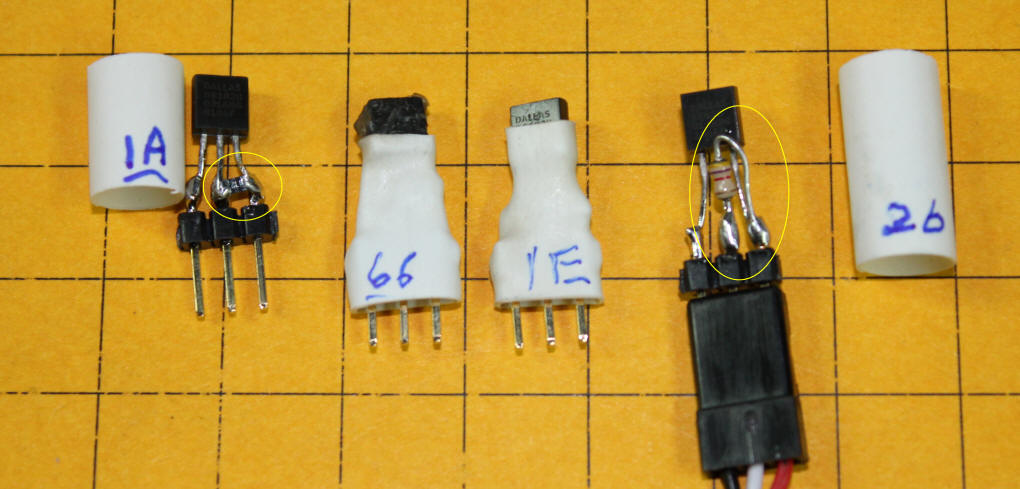
Reading DS18B20s Follow information here: http://www.cl.cam.ac.uk/freshers/raspberrypi/tutorials/temperature/index.html Basically you connect the DS18B20's three pins to ground, + 3.3 volts and GPIO #4 - note that other GPIO pins will NOT work. Pin 1 goes to ground, pin 2 to GPIO #4 and pin 3 to + 3.3 volts Don't forget the 4.7K resistor between pins 3 and 2! This photo shows four of my sensors. Each has been soldered to a 3 pin
header to facilitate connecting them to the main cables. The sensor at the
right has a 1/8 watt 4.7K ohm resistor between pins 2 and 3. The sensor at
the left has a surface mount resistor between pins 2 and 3. The small
section of heat shrink tubing insulates the connections and allows me to label
the sensors with the last two digits of their hex serial number. I
installed a 4.7K ohm resistor on each sensor while I was experimenting but only
ONE resistor is needed for any group of sensors that are wired in parallel.
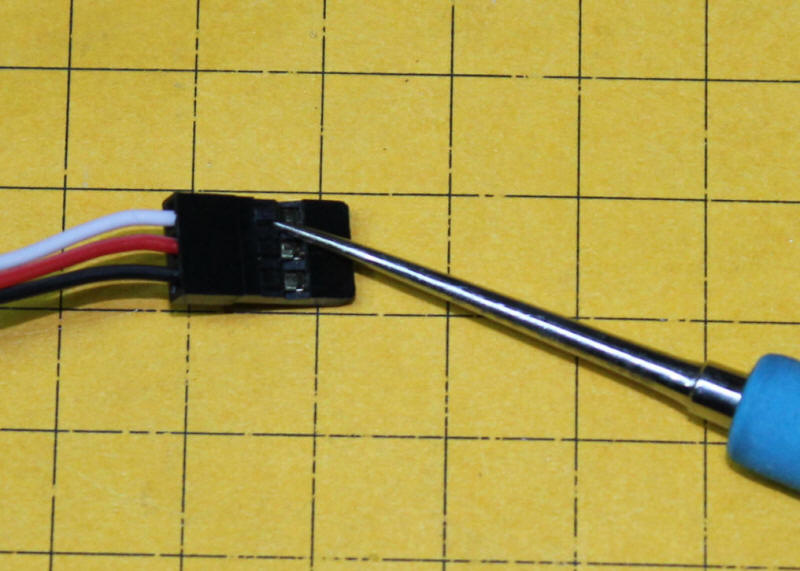
The connectors that I plug the sensors into are meant to be used as servo extension cables and are available here: http://dx.com/p/300mm-3-pin-servo-leads-connection-extension-cables-10-pack-11985 - note that the wires can be rearranged in the plugs by gently prying up the plastic lock on each wire and pulling the wire and connector out and reinserting in the proper position - I redid them so that red was at one end, black at the other and white in the middle.
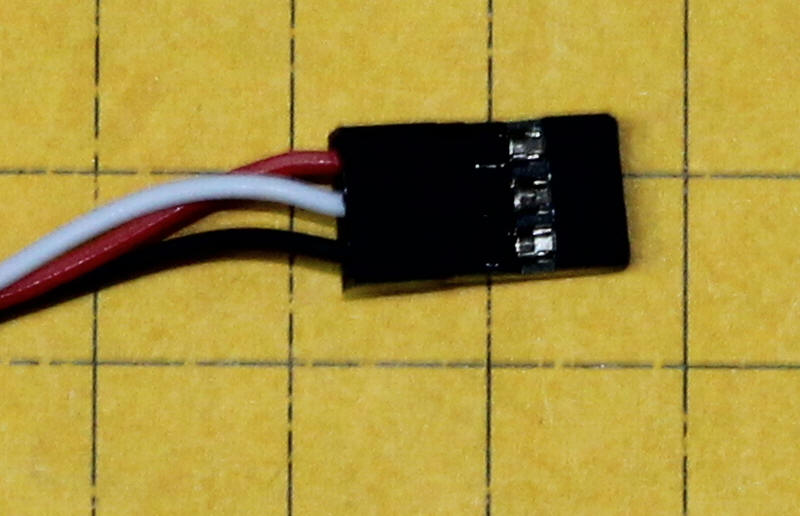
Here the wires have been moved to match the pins on the sensor.
It is important to note that a number of sensors can be wired in parallel to the same three pins on the Pi. My house sensor setup has eight DS18B20s wired together. The length of the connecting wire is quite long as sensors go outside, to the garage, to the basement, first & second floor as well as to the input and output pipes on our how water furnace and the hot water heater. There is in excess of 80 feet of wire in this setup. The wires to the four pond sensors go outside through a 100 foot long piece of cat 5 Ethernet cable.
From the Pi's terminal make sure you run and check directory - NOTE: You have to run this pair of commands each time you reboot to reestablish the sensor directories! Under that directory (/sys/bus/w1/devices/) you should see a folder for each DS18B20 by serial number like this: 28-000003841348 The four directories are for the four sensors that I had connected when I ran w1-gpio and w1-therm. If you use more or fewer sensors you will see a different number of directories. |
| FTP On my system I store the graph files from the temperature readings on my existing web page. To get the updated graph files to the web server I use FTP - if you plan on doing something similar follows these steps otherwise they can be skipped.
curl -u u35664817:password ftp://davebodnar.com/public_html/DGB/pond/temperature/ -T last150.gif Notes on how to call curl from within PYTHON are here: http://www.raspberrypi.org/phpBB3/viewtopic.php?f=32&t=16958&p=174670 The commands that I used within Python are shown here: import os # Import the os libraryos.system("curl -u u35664817:password
ftp://davebodnar.com/public_html/DGB/pond/temperature/ -T
last150.gif") |
|
Sample data file segment
(houseout.txt)for 8 sensors format is date time t 1 t 2 t 3 t 4 t5 t6 t7 t8
09-28-2012 08:09:20 73.51 58.21 63.95 83.53
72.84 72.61 73.06 72.50 |
|
Four Files Make It All Happen My implementation of temperature logging uses four files. The first Python file, called 8House.py, reads the eight DS18B20 sensors that are scattered around the house and logs their readings to a text file called houseout.txt. A snippet from this file is shown in the previous section. This file is updated and new data is appended every five minutes. Next the Python file calls GnuPlot, a command line graph creating program. To download GnuPlot type the following from a terminal on the Pi: sudo apt-get install gnuplot 8House.plt The Python file calles GnuPlot using the script file at the end and the graph (house.gif) is sent to the server via FTP using curl. A second set of programs, 8House300.py and house300.plt, are used to generate a second house graph that is composed of only the last 300 readings, representing about 1500 minutes or about one day. You will note that the 8House300.py program also sends the two text files (houseout.txt and houseout300.txt) to the web server so that they are available for web access. |
|
Complete PYTHON File - new version for eight sensors #version 8House.py def makeTemp(_serialnum): for i in range(5): filename="/sys/bus/w1/devices/"+_serialnum tfile= open(filename) text = tfile.read() tfile.close() secondline = text.split("\n")[1] temperaturedata= secondline.split(" ")[9] temperature = float(temperaturedata[2:]) temperature = temperature / 1000 global fahrenheit fahrenheit = temperature * 9 / 5 + 32 fahrenheit = ("%.2f" % fahrenheit) firstline = text ccrrcc = firstline.split(" ")[11] ccrrcc = (ccrrcc[:3]) #take only first 3 characters global noflag noflag = 0 if ccrrcc == 'YES': ### print 'is YES ', break else: print ' NO NO NO NO NO NO NO NO NO NO NO' print _serialnum noflag = 1 def dotime(): #do this once to reestablish folders after
reboot while True: |
The GNUPlot file is here: - new version for eight sensorsset terminal gif small size 900, 968 transparent# x000000
set output "last150.gif"
set time
#set size 1.0,0.500
set y2tics
set grid
set title "Pond and House Temperatures - Test Graph - Revision coming soon" # 0.000000,0.000000 "";
set ylabel "Degrees Fahrenheit" # 0.000000,0.000000 ""
set xlabel "\n15 Minute Observations"
set key below
plot 'graphout.txt' using 3 title "Basement" with lines,\
'graphout.txt' using 5 title "Pond" with lines,\
'graphout.txt' using 6 title "Pi CPU" with lines,\
'graphout.txt' using 4 title "Ambient" with lines\
'graphout.txt' using 7 title "New1" with lines\
'graphout.txt' using 8 title "New2" with lines\
'graphout.txt' using 9 title "New3" with lines\
'graphout.txt' using 10 title "New4" with lines
set output
|
|
Complete PYTHON File - new version for eight sensors #version 8House300.py def makeTemp(_serialnum): for i in range(5): filename="/sys/bus/w1/devices/"+_serialnum tfile= open(filename) text = tfile.read() tfile.close() secondline = text.split("\n")[1] temperaturedata= secondline.split(" ")[9] temperature = float(temperaturedata[2:]) temperature = temperature / 1000 global fahrenheit fahrenheit = temperature * 9 / 5 + 32 fahrenheit = ("%.2f" % fahrenheit) firstline = text ccrrcc = firstline.split(" ")[11] ccrrcc = (ccrrcc[:3]) #take only first 3 characters global noflag noflag = 0 if ccrrcc == 'YES': break else: print ' NO NO NO NO NO NO NO NO NO NO NO' print _serialnum noflag = 1 def dotime(): import datetime now=datetime.datetime.now() global timestring timestring = now.strftime("%m-%d-%Y %H:%M:%S") #do this once to reestablish folders after reboot import os os.system("sudo modprobe w1-gpio") os.system("sudo modprobe w1-therm") while True: import time noflag=0 makeTemp ("28-0000027b73c2/w1_slave") #basement C2 temp1=" " + str(fahrenheit)+ " " makeTemp ("28-00000383d1ee/w1_slave") #Ambient EE temp2=str(fahrenheit) + " " makeTemp ("28-00000221156d/w1_slave") #1st Floor 6D temp3=" " + str(fahrenheit)+ " " makeTemp ("28-00000272504e/w1_slave") #Furnace 2 4e temp4=str(fahrenheit) + " " makeTemp ("28-0000027baea0/w1_slave") #Hot H2O heater A0 temp5=str(fahrenheit) + " " makeTemp ("28-00000383ddf0/w1_slave") #Furnace 1 F0 temp6=str(fahrenheit) + " " makeTemp ("10-0008004c1266/w1_slave") #2nd Floor 66 temp7=str(fahrenheit) + " " makeTemp ("10-0008004c041e/w1_slave") #Garage 1E temp8=str(fahrenheit) + " " dotime() timestring = timestring + temp1 + temp2 + temp3 + temp4 + temp5 + temp6 + temp7 + temp8 ## + temp9 + temp10 + temp11 + temp12 print "hex numbers = C2 7B 18 48 6D 4E A0 F0 66 1E" print "time string = ",timestring fo=open("houseout.txt","a+") fo.write(timestring) fo.write ("\n") fo.close() import os os.system("gnuplot 8House.plt") print "graph 1 generated" os.system("curl -u u35664817:pwpwpw ftp://place.com/public_html/DGB/pond/temperature/ -T house.gif") print "file transferred" #create file of newest 300 readings filename = 'houseout.txt' file = open(filename) lines = 0 for line in file: lines += 1 print '%r has %r lines' % (filename, lines) file.close() print "did we get to here?" currentline = 0 input = open("houseout.txt","r") output = open("houseout300.txt","w") while currentline < lines: currentline = currentline + 1 print currentline," ",lines-300, " ", lines item = input.readline() if currentline > (lines-300): output.write(item) print "writing item " ,item print "all done" input.close() output.close() os.system("gnuplot 8House300.plt") print "graph 2 generated" os.system("curl -u u35664817:pwpwpw ftp://place.com/public_html/DGB/pond/temperature/ -T house300.gif") print "file 2 (house300.gif) transferred" os.system("curl -u u35664817:pwpwpw ftp://plaace.com/public_html/DGB/pond/temperature/ -T houseout.txt") print "file 3 (houseout.txt) transferred" os.system("curl -u u35664817:pwpwpw ftp://place.com/public_html/DGB/pond/temperature/ -T houseout300.txt") print "file 4 (houseout300.txt) transferred" print "Sleeping for 5 minutes" for i in range(300): #about 5 minutes time.sleep(1) |
|
The GNUPlot file is here: - new version for eight sensors
and 300 latest readings
set terminal gif small size 640, 480
transparent# x000000
|