Weather Station Data Collection
Using The
Raspberry Pi
d. bodnar   revised 8-29-13

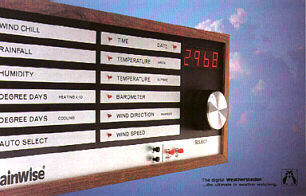
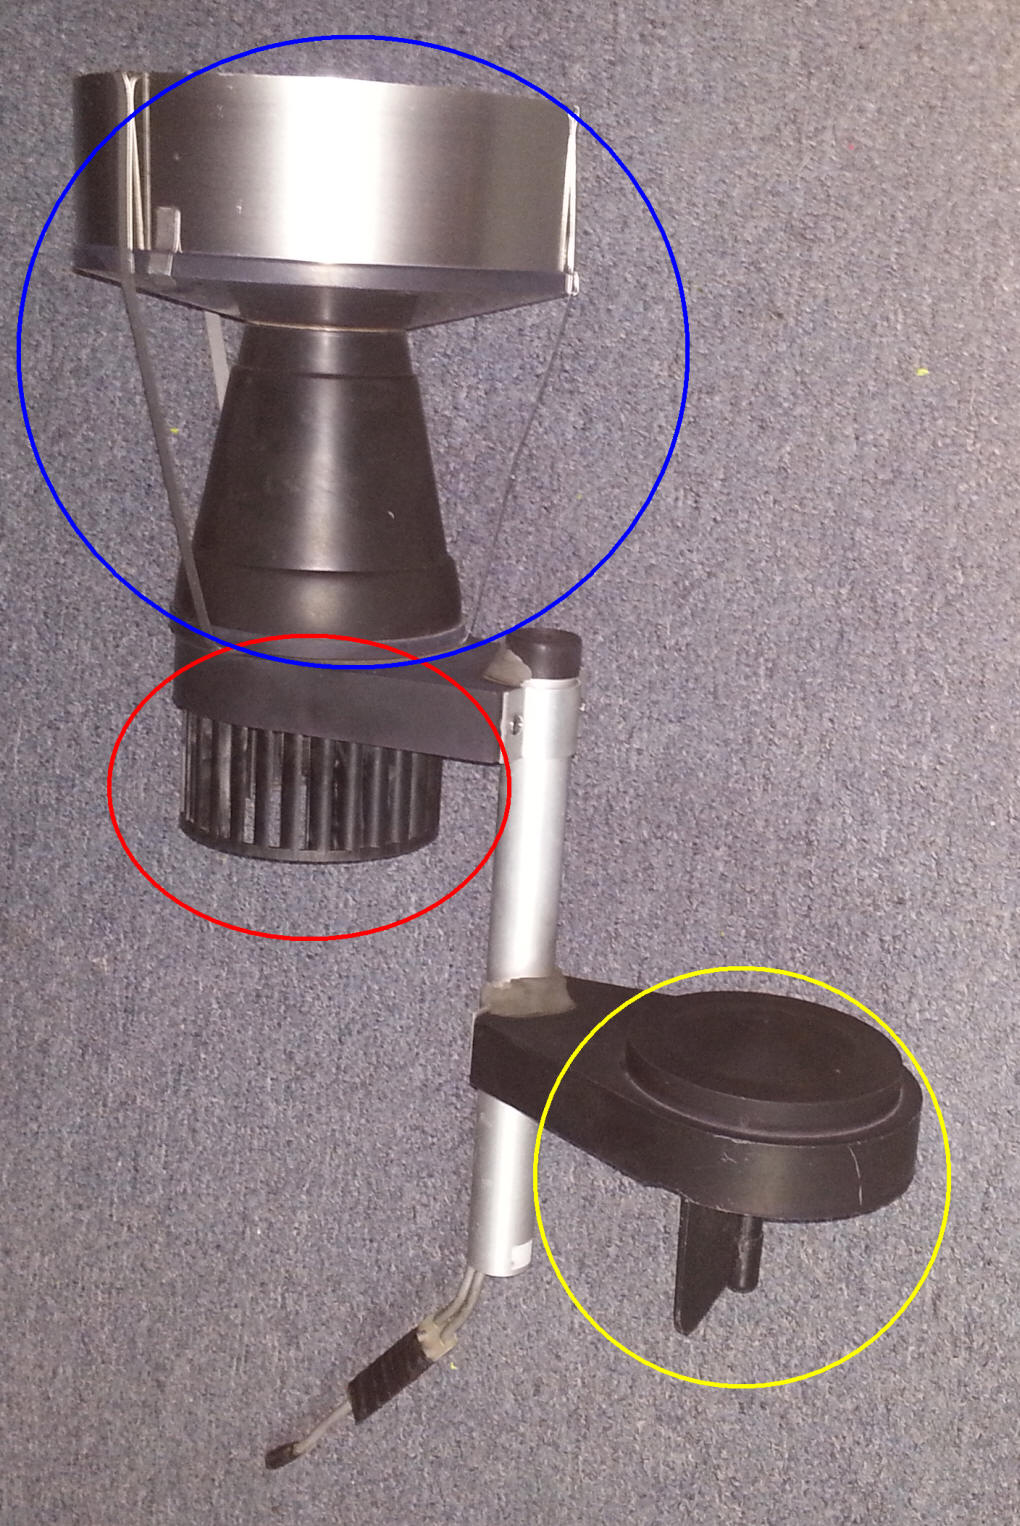
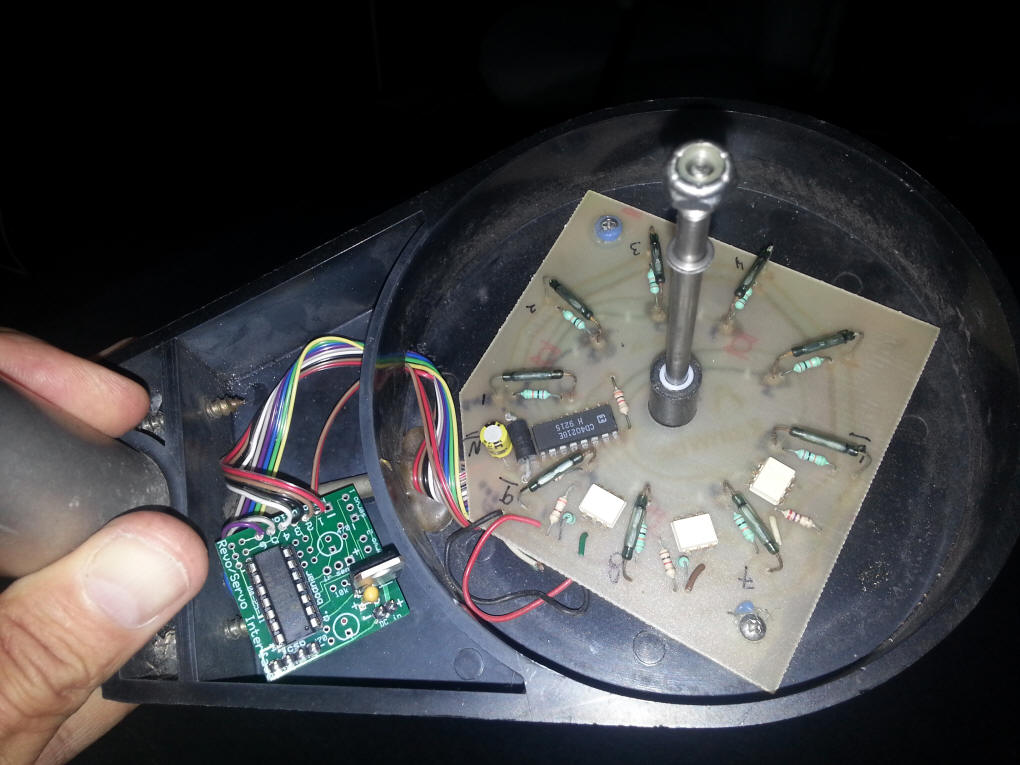
Overview
I have had a weather station at home for a number of years.  The most sophisticated unit is an older system from RainWise, the WS-1000

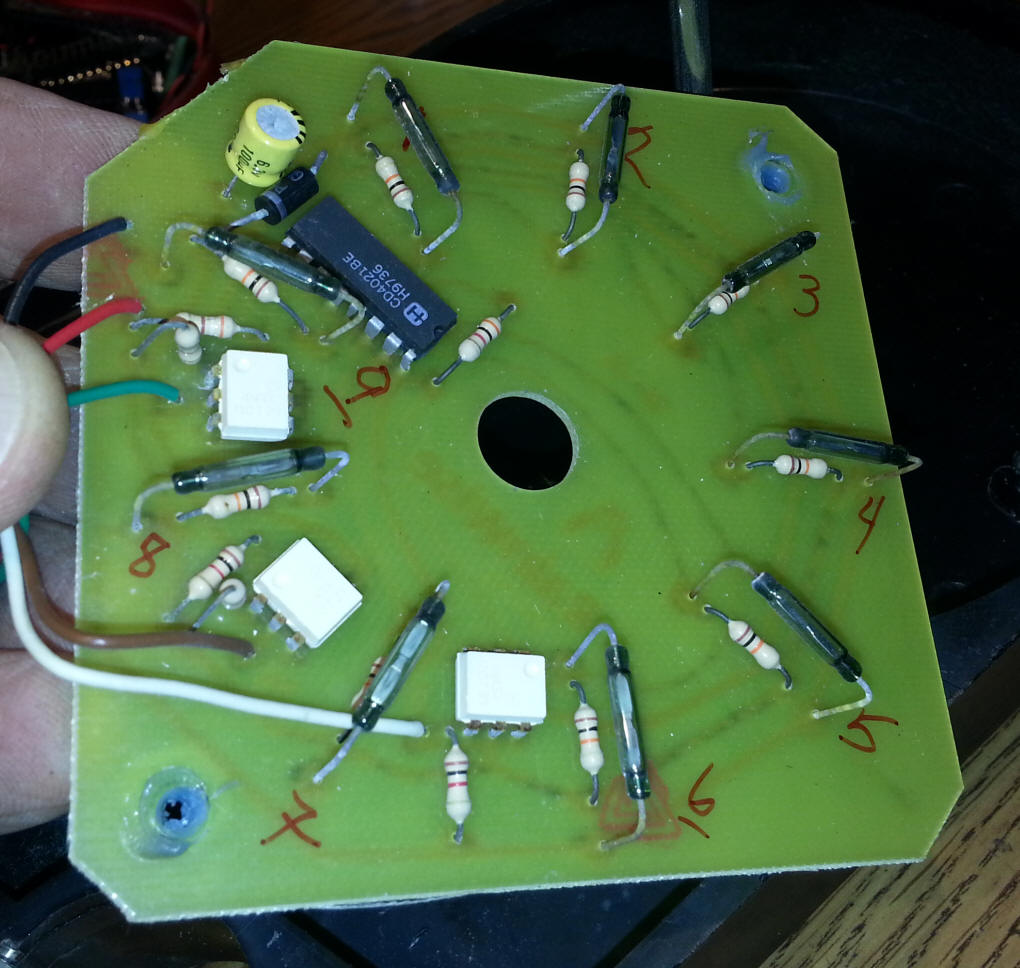
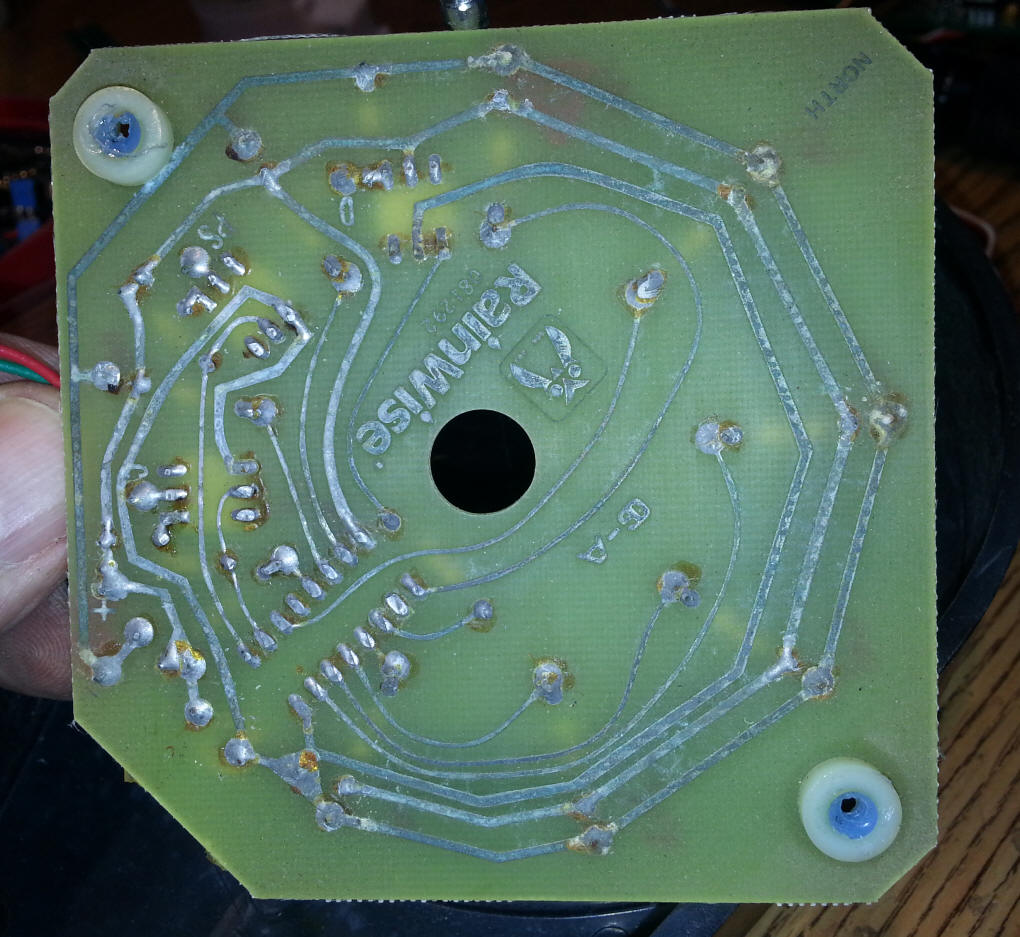
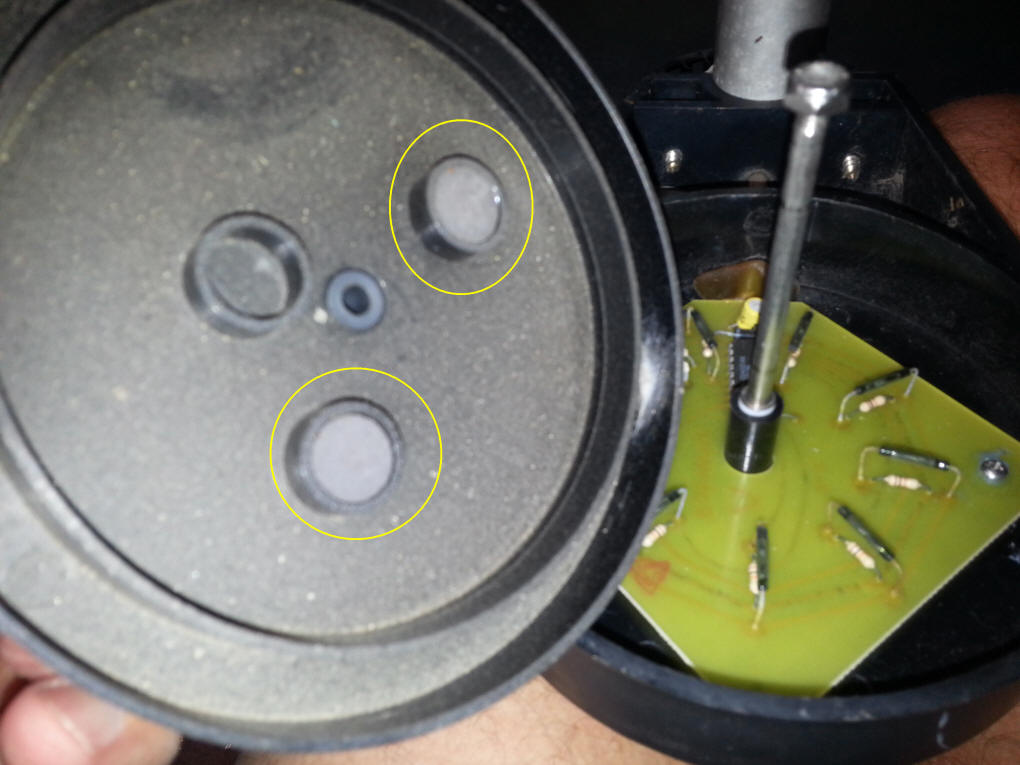
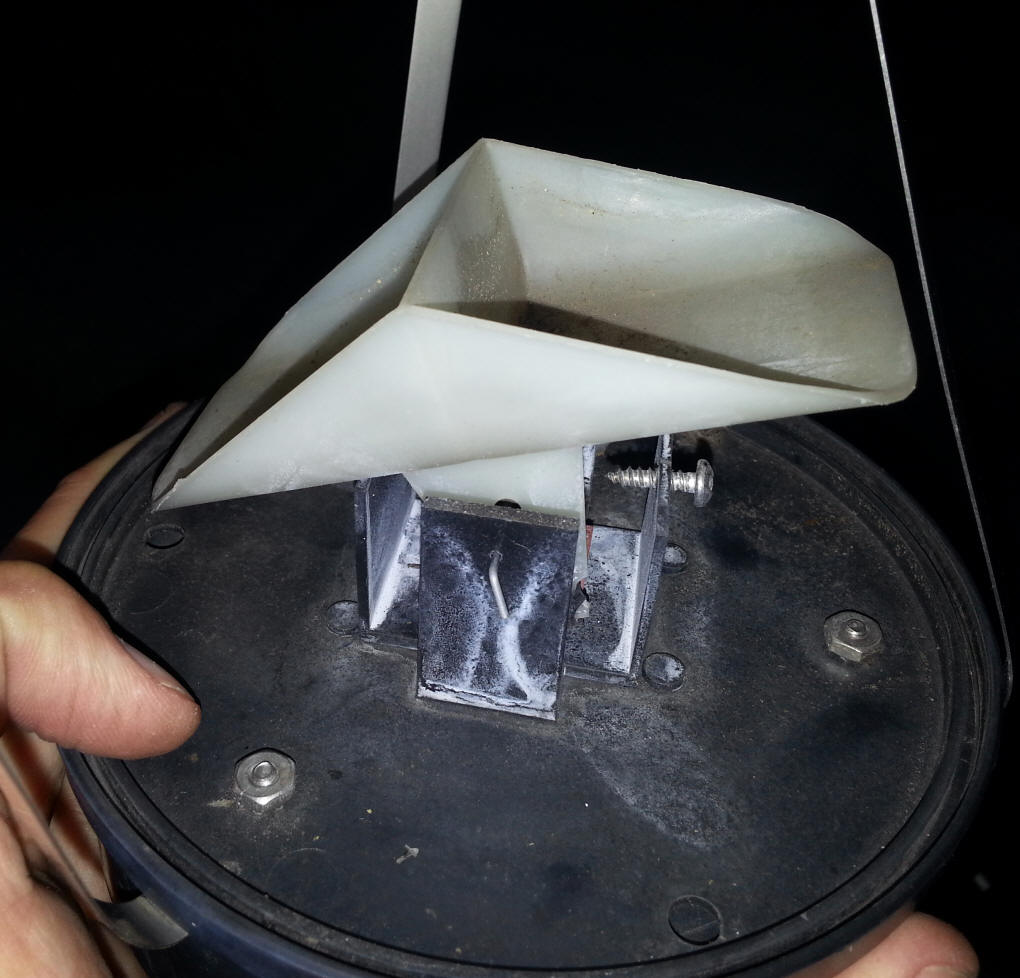
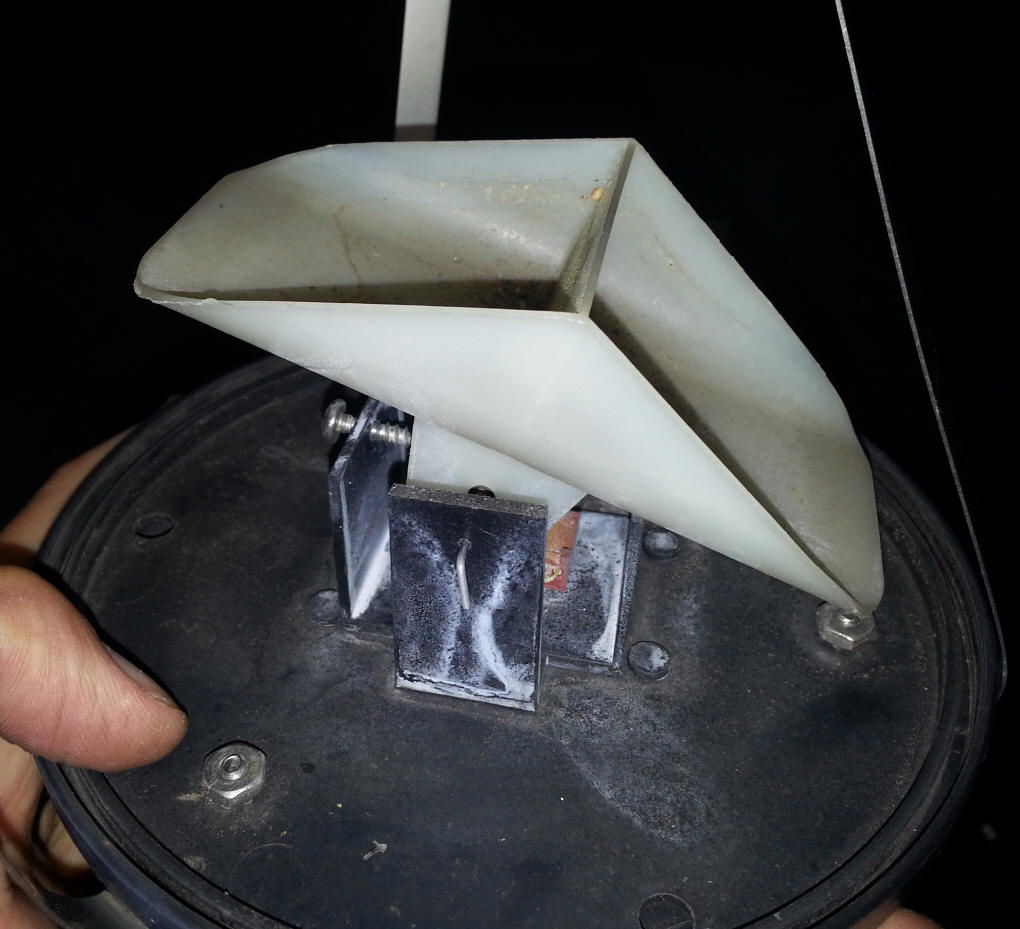
It includes a rain gauge, anemometer, wind vane and temperature, humidity and barometric pressure sensors.  The data is stored and can be displayed by the console shown above.

While this system was state-of-the-art in its day it is quite old and I decided to do some upgrades so that I had a bit more control over its operation and had a better chance of maintaining it.  With this in mind I retired the console unit and began disassembling the rain gauge, anemometer & wind vane unit so that I could install my own PIC based electronics.

I also chose a humidity sensor, 1 wire temperature sensor and barometric pressure sensor all of which connect directly to the Raspberry Pi.

What follows is a compilation of my notes on the conversion of the WS-1000, connecting sensors to the Pi and the custom hardware and software that connects it all together.

It is not intended to be a tutorial but notes that will help me to maintain and upgrade the system in the future.

The results of some of the experiments discussed here can be see on this web page

http://www.trainelectronics.com/RaspberryPi/Graph_Temperature/Graph.htm

It includes graphs from various sensors attached to the Pi.


Raspberry Pi Setup

Start with the newer Raspberry Pi, Model B (It has more internal memory) and download and install the operating system onto an 8 gig SD card -  http://www.raspberrypi.org/downloads - I used  2013-07-26-wheezy-raspbian.zip

Once installed do the following:

Hardware Connections
The following pins on the Pi's 26 pin i/o header will be used:
  • Serial connection to PIC processor (full instructions are here)
    • Pin 1 - 3.3 volts - to + on MAX3232 board (red wire)
    • Pin 6 - ground - to - on MAX3232 board (black wire)
    • Pin 8 - UART TXD - to R on MAX3232 (orange wire)
    • Pin 10 - UART RDX - to T on MAX3232 (brown wire)
  • Humidity / temperature sensor (DHT11 )
    • Pin 1 - 3.3 volts
    • Pin 6 - ground
    • Pin 11 - GPIO 17
  • 1 wire temperature sensor (DS18B20)
    • Pin 1 - 3.3 volts - to + on MAX3232 board (red wire)
    • Pin 6 - ground - to - on MAX3232 board (black wire)
    • Pin 7 - GPIO 4
  • Barometric Pressure Sensor (BMP085 )
    • Pin 1 - 3.3 volts - to vcc on board
    • Pin 6 - ground  - to gnd on board
    • Pin 3 - SDA - to sda on board
    • Pin 5 - SLC - to scl on board
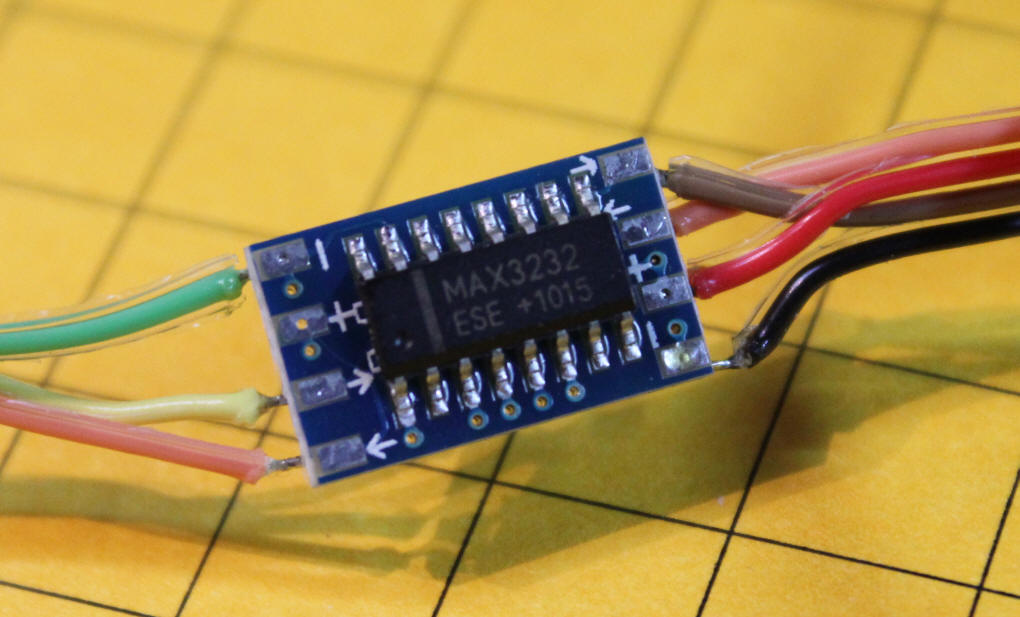
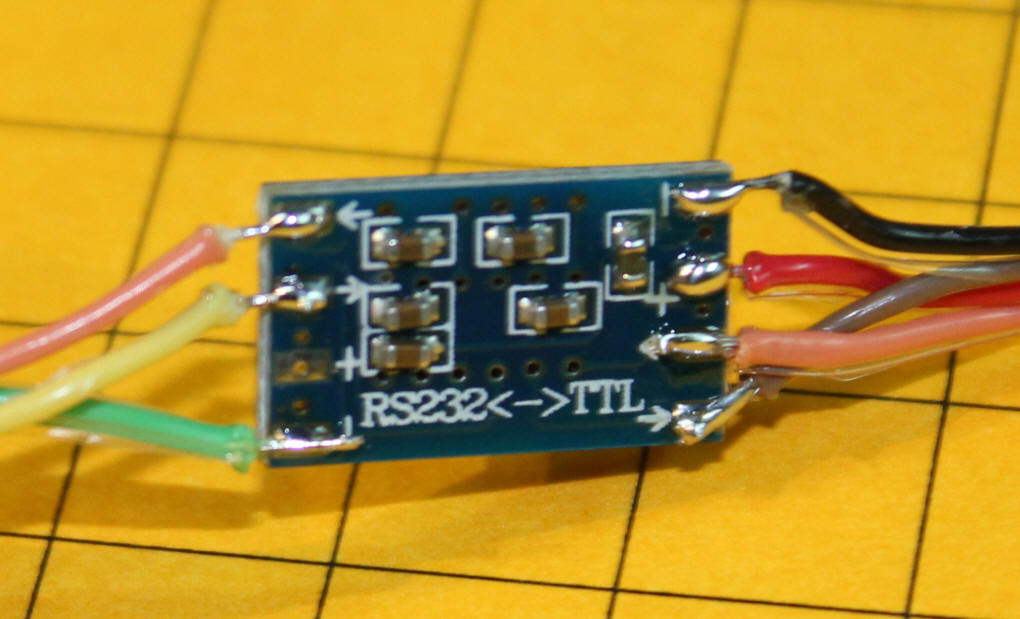
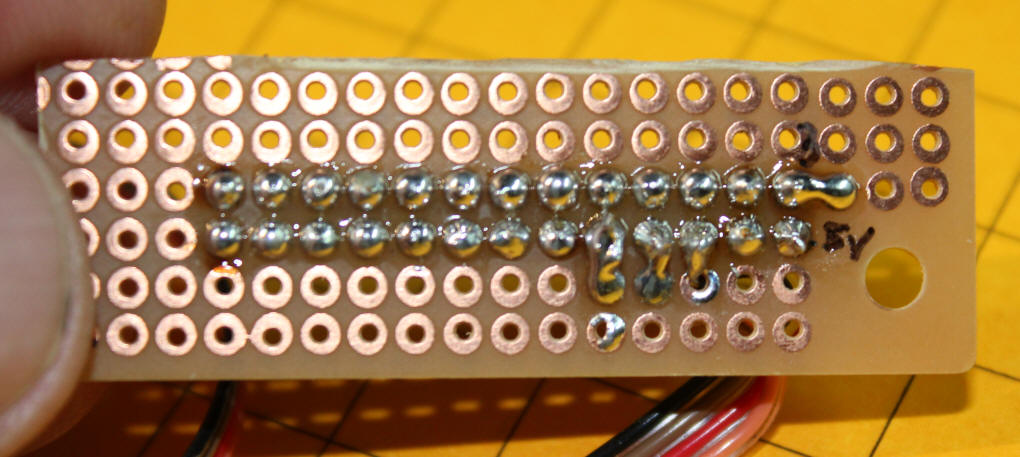
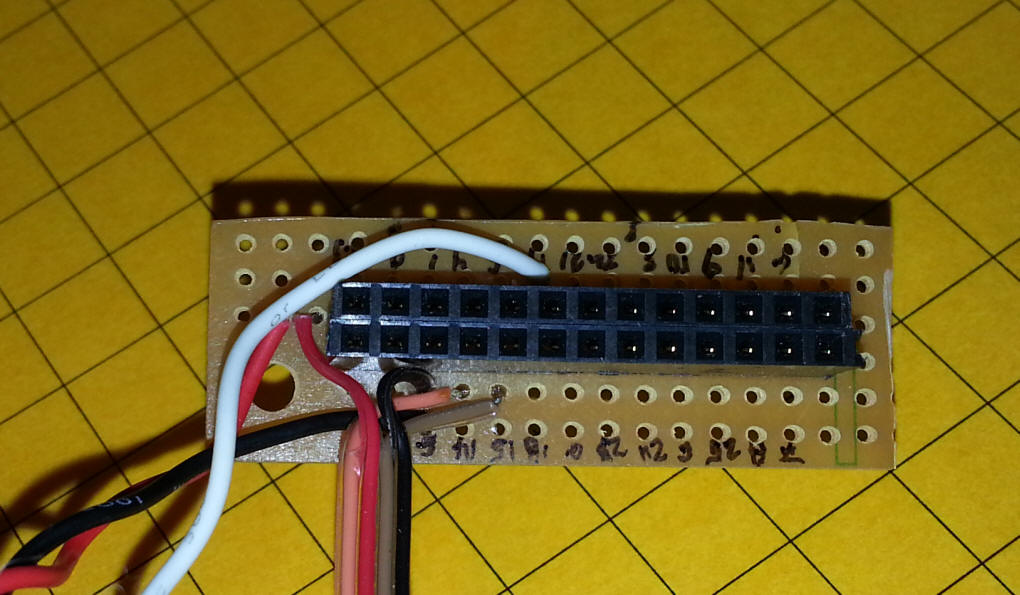
Serial Connection
The serial connection between the PIC (that receives & interprets wind speed, wind direction and rainfall) must have its level adjusted to exchange information with the 3.3 volt Pi.  This is done with the MAX3232 - this page has more details about how this is done. 
http://www.trainelectronics.com/RaspberryPi/#Connecting_to_the_built-in_RS-232_Port_with_a_MAX3232

These photos show how I did the wiring.  This device is the MAX3232 converter, top view of the wiring, which is done on the back.

The RS-232 on the PIC connects on the left and the Pi on the right.

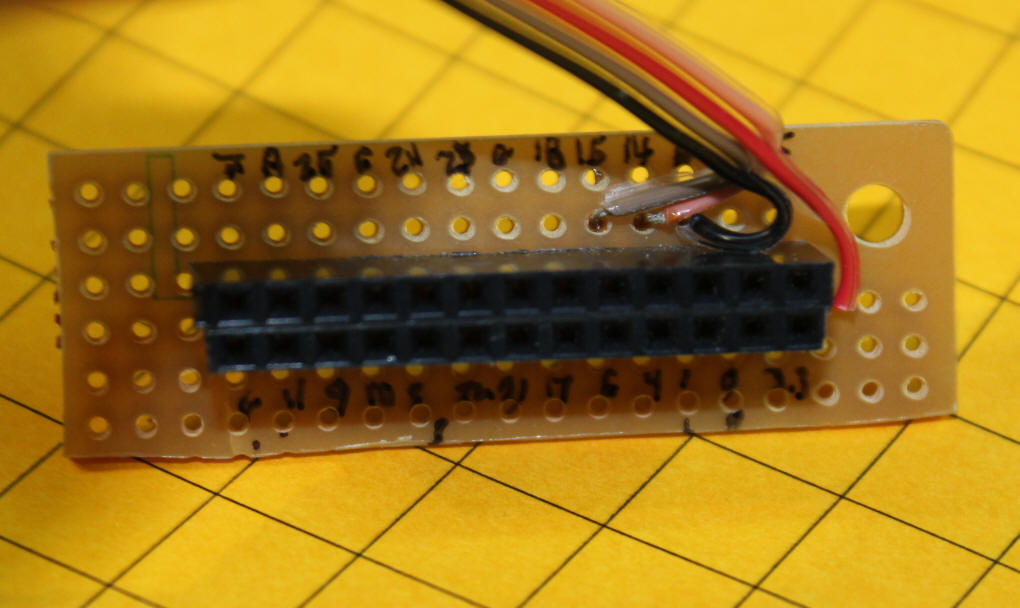
This plug goes into the IO header on the Pi - pins 1 and 2 are on the right.

This is a top view of the plug - pins 1 and 2 are on the right.

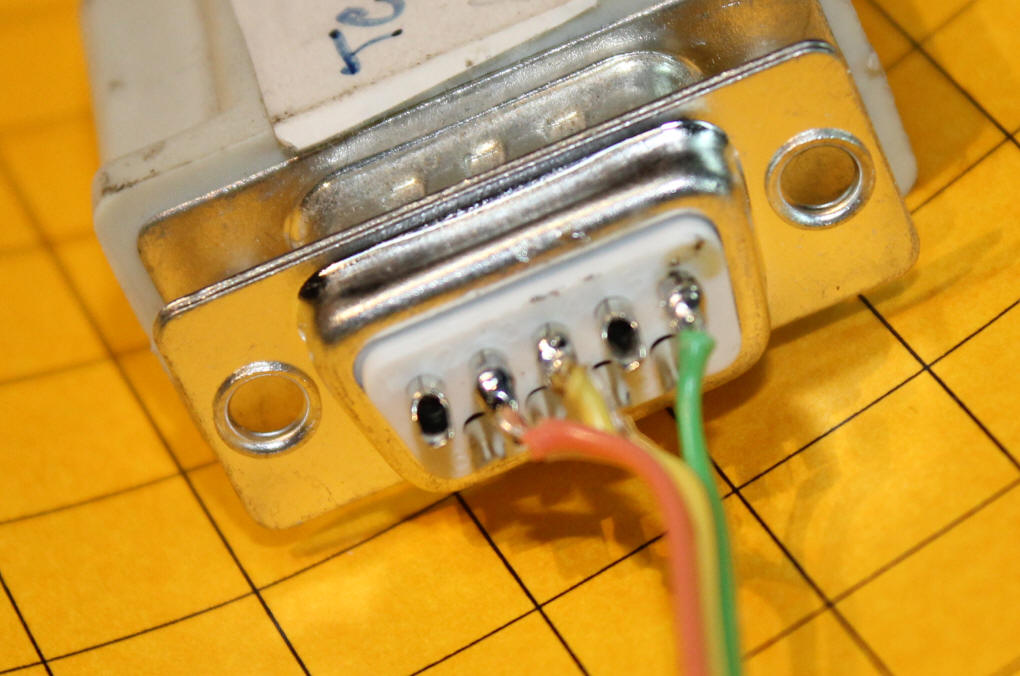
Here are the DB9 connections using pins 2 (orange), 3 (yellow) and 5 (green).

Serial Port Testing
To test the serial connection between the DB-9 and the Pi you can do the following:

  • Install the Python serial routines with   sudo apt-get install python-serial
  •  Disable serial login by editing    /etc/inittab
    • put a remark symbol (#) before the line that includes "ttyAMA0" as below
      #Spawn a getty on Raspberry Pi serial line
      #T0:23:respawn:/sbin/getty -L ttyAMA0 115200 vt100
    • Reboot
  • You can test with minicom (sudo apt-get install minicom) - run sudo minicom -s to change port & speed & such
  •  Run this Python program on the Pi - I titled it  serial12-loop-OK5.py
    import time
    import serial
    s = serial.Serial("/dev/ttyAMA0", 9600, timeout=0.9)

    for i in range (1,600000):
    print "at top", i
    data = s.readline() #reads up to 1024 characters, or until \r\n or until timeout (if set)
    if (data.startswith('D')):
    print "found D"
    print data
    # time.sleep(1)
  • Note that whatever you type must start with a capital "D" to be recognized
  • I used a PIC to send test data - the program (for a 12F683) is here:

    'WX Date to Pi test d. bodnar 8-9-13

    Include "modedefs.bas"
    ansel  = 0
    cmcon0 = 7
    Serial_out   var   gpio.0 'pin 7 '
    TIP101       var   gpio.2 'pin 5 hpwm 1
    SerToPi      var   gpio.5 'pin 2
    Temp         var   word
     
    Serout serial_out,n9600,[13,10,"d. bodnar Ver 1.0 Send serial to Raspberry Pi",13,10]
    Serout serial_out,n9600,[13,10,"Careful with oscillator and baud rate!",13,10]
    Serout serial_out,n9600,[13,10,"08-03-13",13,10]
    Serout serial_out,n9600,[13,10,"MUST disable serial login on Pi! See:",13,10]
    Serout serial_out,n9600,[13,10," http://www.hobbytronics.co.uk/raspberry-pi-serial-port",13,10]

    gpio = %00000000 'all outputs
    Temp=0
    Testing:
      high tip101 'flash LED during send
      serout Sertopi,n9600,["D=330 S=00000 R=002 ",#temp ,18,14]
      low tip101
      pause 1000
      Temp = temp + 1
    goto testing

     
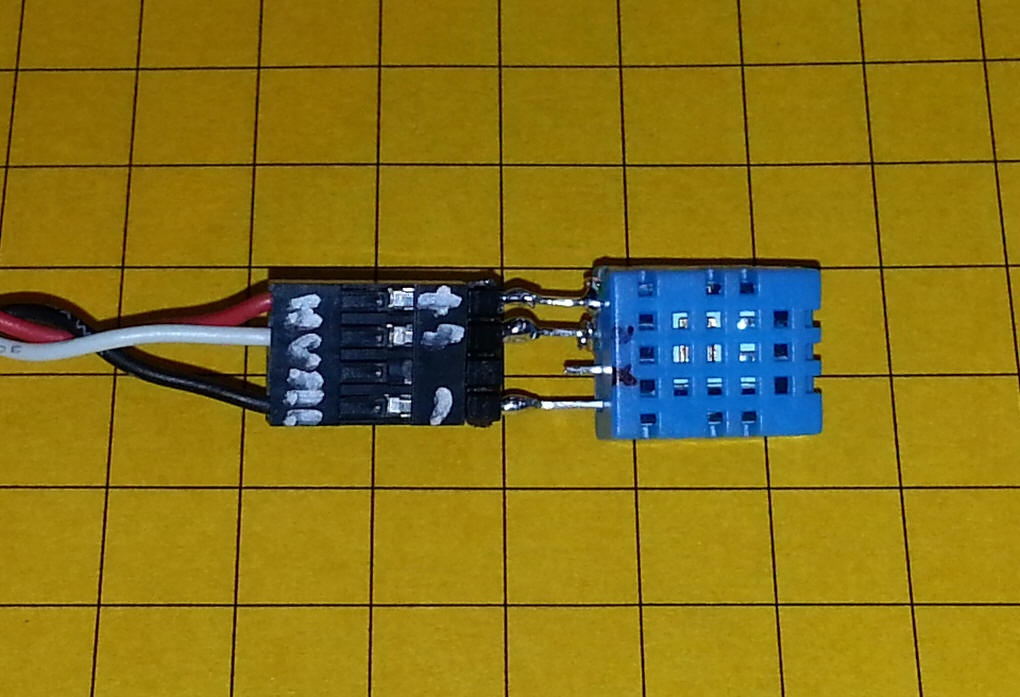
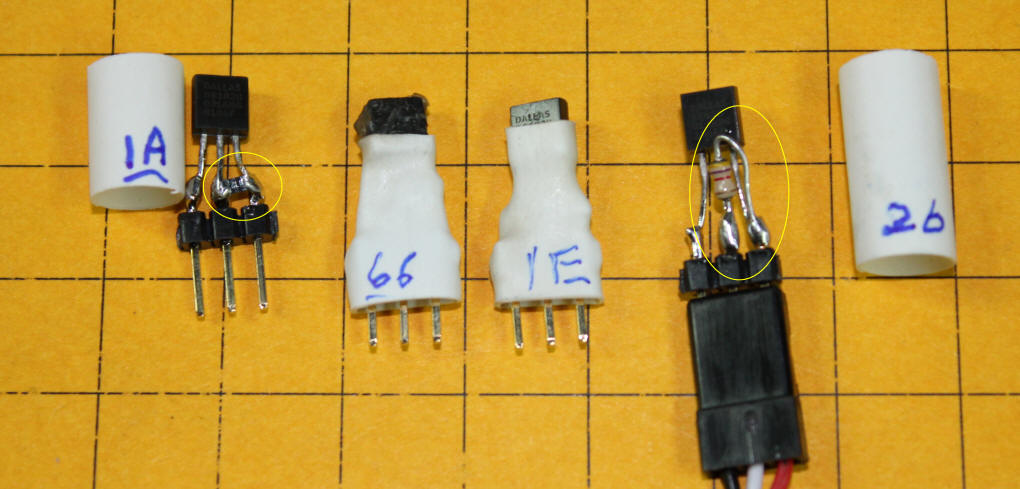
Humidity / Temperature Sensor
The
DHT11 is an inexpensive humidity sensor.  It also measures temperature.  Since it's temperature sensing may not be as accurate as it could be I chose to use a 1 wire temperature sensor as well (see next section)

More detailed information on using the DHT11 is here: http://www.trainelectronics.com/RaspberryPi/Graph_Humidity/

Connect the sensor to the interface board

  • Pin 1 - 3.3 volts
  • Pin 6 - ground
  • Pin 11 - GPIO 17

The red wire goes to the 3.3 volt positive connection on the DHT11, the white wire goes to the data line and the black wire to ground.  Note that the 3rd pin is not connected.

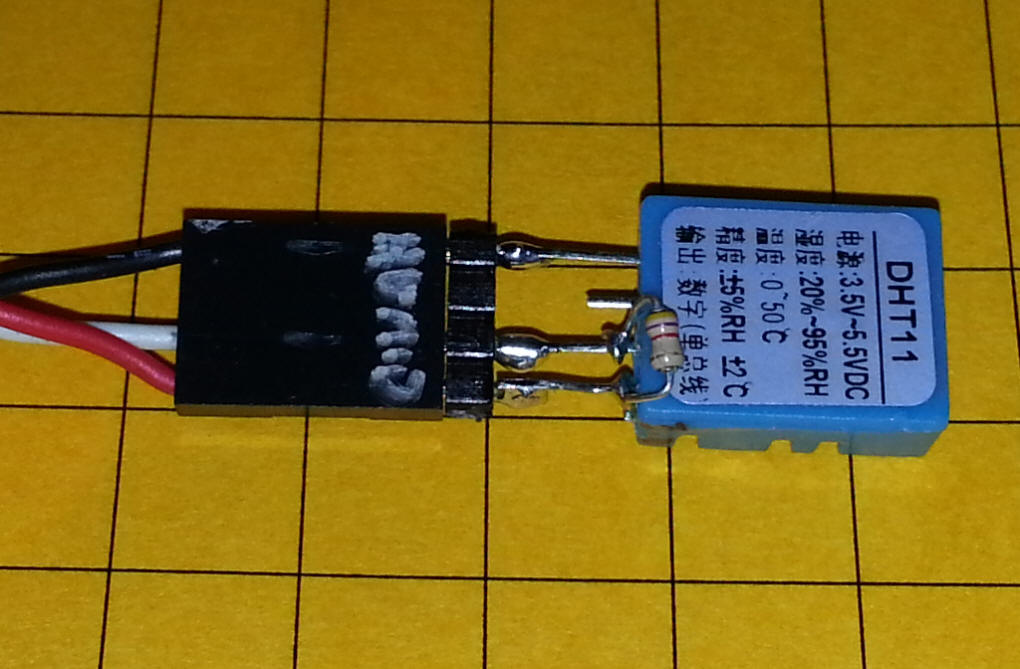
In this view you can see the 10K resistor that goes between the data line and +3.3 volts.

Here the connections to the i/o plug can be seen.  The data line (white) goes to pin 11, GPIO 17.  Power and ground go to + 3.3 volts and ground.

Software for DHT11
Get the software that is used to read the sensor

git clone https://github.com/adafruit/Adafruit-Raspberry-Pi-Python-Code.git

The command that I use to read the sensor is below - note that the "11" before the "17"  that identifies  the port is the type of device.

sudo Adafruit-Raspberry-Pi-Python-Code/Adafruit_DHT_Driver/Adafruit_DHT 11 17

This same command can be used from within a Python program.

DS18B20 1 Wire Temperature Sensor
The humidity sensor and the barometric pressure sensor each give a temperature reading in addition to their primary function.  The humidity sensor will go outside (in a proper, shaded enclosure) so it could be used for temperature readings.  Its readings compare favorably with those from other sensors but I like to have the option of using the DS18B20 as well.

This link has detailed information on using these sensors:  http://www.trainelectronics.com/RaspberryPi/Graph_Temperature/index.html

The short version is as follows:

  • Connect the DS18B20's three pins to ground, + 3.3 volts and GPIO #4 - note that other GPIO pins will NOT work.
  • Pin 1 goes to ground, pin 2 to GPIO #4 and pin 3 to + 3.3 volts
  • Don't forget the 4.7K resistor between pins 3 and 2!

    In this photo pin #1 is to the left, pin #2 is in the center and pin #3 is to the right.  The resistor (circled in yellow) goes between the data line (pin 2) and plus 3.3 volts (pin 3).  After soldering the resistor the 3 pins are soldered to a 3 pin header then wrapped in heat shrink tubing.  The number on the tubing is the last two digits of the sensor's unique ID number.

    Once the sensor has been connected follow these steps:

  •  From the Pi type
    sudo modprobe w1-gpio
    sudo modprobe w1-therm
  • this sets up the software to read the sensor
  • Next type
     
    cd /sys/bus/w1/devices/   to move to the devices directory
  • from there type
    ls     to list a directory
  • You should see something like:
    28-000002723c9f   this identifies the serial number of the sensor
  • to read the sensor type
    cat 28-000002723c9f/w1_slave
  • you should see something like this:
    b1 01 4b 46 7f ff 0f 10 8d : crc=8d YES
    b1 01 4b 46 7f ff 0f 10 8d t=27062
  • The temperature in Celsius is after the "t=" - just place a decimal point three digits to the left
    27062 = 27.062 degrees C

     
Barometric Pressure Sensor
To measure atmospheric pressure I use a BMP085 sensor.  This web site has details on its use with the Pi:

http://learn.adafruit.com/using-the-bmp085-with-raspberry-pi/using-the-adafruit-bmp085-python-library

These are the basic steps that you need to follow to use this sensor: 

Software Objectives
The Raspberry Pi software will be configured to do the following:
  • Read the data stream from the rain gauge, wind speed & wind direction unit - serial @ 300 baud
    • Convert the raw speed data (length of pulses in milliseconds ) to miles / hour - may need to change routine for this reading and use car mounted anemometer to get speed table
    • Format and save the wind direction in degrees
    • Format and save the rainfall in 1/100" increments
    • Format and save the time of day and date
  • Read humidity, format and store (includes temperature) - sensor outside
  • Read temperature, format and store (from DS18B20) - sensor outside
  • Read barometric pressure, format and store (includes temperature) - sensor inside
  • All done by one program (in Python)
  • Data written to disk
    • once per minute
    • format: day, time, wind speed, wind direction, rainfall, humidity, barometer
    •  mm/dd/yyyy hh:mm:ss wsmph wd rf hum pressure
  • When (how?) to reset rainfall -
    • perhaps never - just keep track of what it is since midnight?
    • could run serial out to outside unit to reset
Code Being Used as of 8-28-2013
Barometric Pressure:

Note the two conversions - one corrects for my altitude and the other converts to inches of mercury
#!/usr/bin/python
from Adafruit_BMP085 import BMP085
# ===========================================================================
# Example Code
# ===========================================================================
# Initialise the BMP085 and use STANDARD mode (default value)
# bmp = BMP085(0x77, debug=True)
bmp = BMP085(0x77)
# To specify a different operating mode, uncomment one of the following:
# bmp = BMP085(0x77, 0)  # ULTRALOWPOWER Mode
# bmp = BMP085(0x77, 1)  # STANDARD Mode
# bmp = BMP085(0x77, 2)  # HIRES Mode
# bmp = BMP085(0x77, 3)  # ULTRAHIRES Mode
while True:
        temp = bmp.readTemperature()
        pressure = bmp.readPressure()
        altitude = bmp.readAltitude()
	fahrenheit = temp * 9 / 5 + 32
        print "Temperature: %.2f C" % temp,
	print  fahrenheit
        print "Pressure:    %.2f hPa" % (pressure / 100.0)
	feet = int (altitude * 39.37 / 12)
        print "Altitude:    %.2f" % altitude ,
	print feet
        temp = 9.0 / 5.0 * temp + 32	#convert to fahrenheit
	import time	
        import datetime
        now=datetime.datetime.now()
        global timestring
        timestring = now.strftime("%m-%d-%Y    %H:%M:%S")
	pressure = pressure * 1.0465959046  #correct barometric pressure for my altitude
	pressure = pressure / 33.8638866667  #convert to in Hg
	print pressure / 100
        timestring = timestring + " "+ str(temp) + " " + str(pressure / 100.0) + " " + str(altitude)
        fo=open("barometer_out3.txt","a+")
        fo.write(timestring)
        fo.write ("\n")
        fo.close()
	import os
       	os.system("gnuplot barometer.plt")
        print "graph 1 generated"
        os.system("curl -u u35664817:pwpwpwpw ftp://davebodnar.com/public_html/DGB/pond/temperature/ -T barometer.gif")
        os.system("curl -u u35664817:pwpwpwpw ftp://davebodnar.com/public_html/DGB/pond/temperature/ -T barometer_out3.txt")

	time.sleep(60)
GNUPLOT Script for Pressure Graph:
set terminal gif small size 640, 480 transparent# x000000
set output "barometer.gif"
set time
set xtics rotate
set xdata time
 
set timefmt "%m-%d-%Y %H:%M"
 
set y2tics
set grid
set title "Barometric Pressure - revised 08-28-13" 
set ylabel " pressure " 
set xlabel "\n5 Minute Observations"
set key below
plot 'barometer_out3.txt' using 1:4 title "Pressure in HG" with lines
set output
 

Python Code Wind Speed / Direction / Rainfall:
 

import time
import serial
s = serial.Serial("/dev/ttyAMA0", 9600, timeout=0.9)
for i in range (1,600000):
	s.flushInput()
        data = s.readline() #reads up to 1024 characters, or until \r\n or until timeout (if set)
        if (data.startswith('D=')):
                print data,
		data = data.replace("=","  ")
		print data
                time.sleep(60)
       	        import datetime
        	now=datetime.datetime.now()
	        global timestring
        	timestring = now.strftime("%m-%d-%Y %H:%M:%S")
	        timestring = timestring + " "+ data
	        fo=open("windrainout.txt","a+")
	        fo.write(timestring)
        	fo.close()
	        import os
       		os.system("gnuplot windrain.plt")
	        os.system("gnuplot winddir.plt")
		os.system("gnuplot rain.plt")
	        print "graphs 1 & 2 generated"
	        os.system("curl -u u35664817:pwpwpwpw ftp://davebodnar.com/public_html/DGB/pond/temperature/ -T windrain.gif")
	        os.system("curl -u u35664817:pwpwpwpw ftp://davebodnar.com/public_html/DGB/pond/temperature/ -T winddir.gif")
	        os.system("curl -u u35664817:pwpwpwpw ftp://davebodnar.com/public_html/DGB/pond/temperature/ -T windrainout.txt")
	        os.system("curl -u u35664817:pwpwpwpw ftp://davebodnar.com/public_html/DGB/pond/temperature/ -T rain.gif")
	        print "file transferred"
Graphs are created from these GNUPLOT scripts:
FOR WIND SPEED:
set terminal gif small size 640, 480 transparent# x000000
set output "windrain.gif"
set time
set xtics rotate
set xdata time
 
set timefmt "%m-%d-%Y %H:%M"
 
set y2tics
set grid
set title "Wind Speed - revised 08-28-13" 
set ylabel "Speed" 
set xlabel "\n5 Minute Observations"
set key below
plot  'windrainout.txt' using 1:6 title "Speed" with lines
 set output
FOR WIND DIRECTION:
# this one works  8-25-13
set terminal gif small size 640, 480 transparent
 
set output "winddir.gif"
set time
set xtics rotate
set xdata time
 
set timefmt "%m-%d-%Y %H:%M"
 
set y2tics
set grid
set title "Wind Direction Only - revised 08-22-13 Test on PC - works!  needs 2 days data "  
set ylabel "Direction" 
 
set xlabel "\n5 Minute Observations"
set key below
plot 'windrainout.txt' using 1:4 title "Direction" with lines
set output
FOR RAINFALL:
set terminal gif small size 640, 480 transparent# x000000
set output "rain.gif"
set time
set xtics rotate
set xdata time
 
set timefmt "%m-%d-%Y %H:%M"
 
set y2tics
set grid
set title "Rainfall - revised 08-28-13" 
set ylabel " rain" 
set xlabel "\n5 Minute Observations"
set key below
plot 'windrainout.txt' using 1:10 title "Rain" with lines
set output

 
Humidity: 
 

Modification of the RainWise WS-1000 Rainfall, Wind Direction and Wind Speed Sensors

This photo shows the RainWise unit that goes on the roof.  The part circled in blue is the rain gauge, the part circled in red is the anemometer and the part in the yellow circle is the wind vane.

This photo shows the wind vane's inner workings.  There are 9 evenly spaced reed switches on the circuit board, each 40 degrees apart (360 degrees / 9 = 40 degrees).  There are two magnets on the moving part of the wind vane (see next photo) that are positioned so that one or two of the reed switches are activated depending on where the wind vane is located.  This arrangement gives 36 different readings, each representing 10 degrees of rotation.

Each of the reed switches has been connected to the PIC processor by the rainbow cable shown here.  This allows the processor to know where the wind vane is pointed.  Its software (below) converts the 9 bit binary number from the 9 reed switches into a number from 1 to 36 (representing 10 to 360 degrees)

The schematic shows the 16F684 that takes care of watching the wind vane and the anemometer.  The 12f683 has one job, watching the rain gauge.  Since the signal from the rain gauge can come at any time and can be missed by the busy 16F684 the smaller chip is dedicated to that task.  The 12F683 toggles a pin each time the bucket trips - since these events can only come every few seconds, even in a driving rain storm, the 16F684 should never miss recording a 1/100" increment in rainfall.

The 16F684 sends data on its readings via a serial line that goes to the receiving unit in the house.

PIC Code for the Wind Vane:

'New Function - Weather Station Wind Vane Reader 7-23-2013
'Working pretty well

DEFINE DEBUG_REG PORTA
DEFINE DEBUG_BIT 0 ' PIN 13 on 16f684
DEFINE DEBUG_BAUD 300
DEFINE DEBUG_MODE 1 ' Set Debug mode: 0 = true, 1 = inverted

DEFINE PULSIN_ MAX 1000'0

'ansel=0 'allows you to use pins as digital rather than analog
CMCON0 = 255 'set to 255 to get pins 8, 9, 10 to work as inupts- probably some other value is better ' Analog comparators on
ANSEL = 0 ' Analog select set to digital, pg 69 data

D1 var portc.3 'pin 7
D2 var portc.4 'pin 6
D3 var portc.5 'pin 5
D4 var portc.0 'pin 10
D5 var portc.1 'pin 9
D6 var portc.2 'pin 8
D7 var porta.2 'pin 11
D8 var porta.1 'pin 12
D9 var porta.4 'pin 3
SDEBUG var porta.0 'pin 13 - serial debug
Anemometer var porta.5 'pin 2
RainG var porta.3 'pin 4 - input only - reads status of rain gauge
'anemometer

option_reg.7=0 'turn on wpu
wpu = %00001000 'weak pull ups on for porta only

trisc = %11111111
trisa = %11111110
'for temp=1 to 5:flag(temp)=0:next temp
debug 13,10,13,10,"Weather Station Wind Vane Reader 7-27-2013 v1.5",13,10,"TrainElectronics.com",13,10
RainTTL var word
RainState0 var byte
RainState var byte
Temp var word
Temp2 var word
Temp3 var word
AnemPulse var word
RainTTL = 0
RainState = 0
'RainState0=Raing
Test:
'debug #raing ',13,10
'goto test:
if rainG <> rainstate then
rainttl = rainttl + 1
rainstate = raing
endif
Temp = d1+d2*2+d3*4+d4*8+d5*16+d6*32+d7*64+d8*128+d9*256
lookdown2 temp,[222,223,207,239,111,367,359,375,311,_ 'ok
439,435,443,411,475,473,477,461,493,_ 'ok
492,494,486,502,246,247,243,251,123,_ 'ok
379,377,381,317,445,444,446,414,478],temp2 'ok
temp3= (temp2+1)*10 ' (degrees)

PULSIN Anemometer,0,anemPulse
debug "D="
if temp3< 100 then
debug "0"
endif
if temp3 < 10 then
debug "00"
else
debug #temp3
endif
debug "S="
if speed <10000 then
debug "0"
endif
if speed < 1000 then
debug "0"
endif
if speed < 100 then
debug "0"
endif
if speed < 10 then
"0"
endif
debug #speed

debug "R="
if rainTTL < 100 then
debug "0"
endif
if rainttl < 10 then
debug "0"
endif
debug #rainttl

goto test:


PIC Code for the LCD Display:

Note:  this processor and the display are in the home and receive data from the 16F684 on the sensor unit via a serial data stream.

'd. bodnar 7-27-13 - Read & display weather station data
DEFINE LCD_DREG PORTC '14 pin chip
DEFINE LCD_DBIT 0
DEFINE LCD_RSREG PORTA
DEFINE LCD_RSBIT 0
DEFINE LCD_EREG PORTA
DEFINE LCD_EBIT 1
DEFINE LCD_BITS 4
DEFINE LCD_LINES 4
DEFINE LCD_COMMANDUS 2000
DEFINE LCD_DATAUS 50
'''define CCP2_REG PORTB '18 pin chip
define CCP2_REG PORTC '14 pin chip
DEFINE CCP2_BIT 1

SerialIn var porta.5 'pin 2 on chip
 
temp var word
temp2 var byte
temp3 var byte
temp4 var byte
temp5 var word
temp6 var word
temp7 var word
temp8 var word
Speed var word
Rain var word
Rain1 var byte
Rain2 var byte
Rain3 var byte
Direction var word
'
TRISA = %00000000

trisc=0:cmcon0=7:ansel=0 'for 14 pin chip
trisc.4=1
trisa.5=1:trisa.4=1 'make pins inputs

top:
 
pause 800 'let LCD unit wake up
LCDOUT $fe,1,"d.bodnarV0.1 7-27-13"
LCDOUT $fe, 192,"Weather Data Reader"
pause 500

startit:
lcdout $fe,1,"Weather Data"
startit2:

serin2 serialin, 27889, [wait ("D="),dec3 Direction, skip 3, dec5 Speed,skip 3, dec3 rain]
lcdout $fe,1,"Direction= ",#direction
lcdout $fe,192,"Speed= ",#speed
lcdout $fe,148,"Rain= ",#rain
goto startit2


______________________________________________________________________________
'lcdout $fe,128,"start of line 1?"
'lcdout $fe, 192,"start of line 2"
'lcdout $fe, 148, "start of line 3?"
'lcdout $fe, 212,"start of line 4"


This is a close-up of the wind vane board.

This is the back of the board before modification.

The two magnets that trigger one or two reed switches on the wind vane board are circled.

This divided bucket toggles from one side.....

... to the other each time 1/100" of rain is collected.

A small magnet (circled in yellow) goes past a small reed switch (circled in red) each time the bucket moves from one side to the other.

Here the anemometer has been opened.  The device that is circled is an infrared photo sensor that detects the movement of the rotating drum.


The two circled slots in the anemometer's drum are sensed as it rotates.  The pulses that are generated are timed and turned into wind speed.